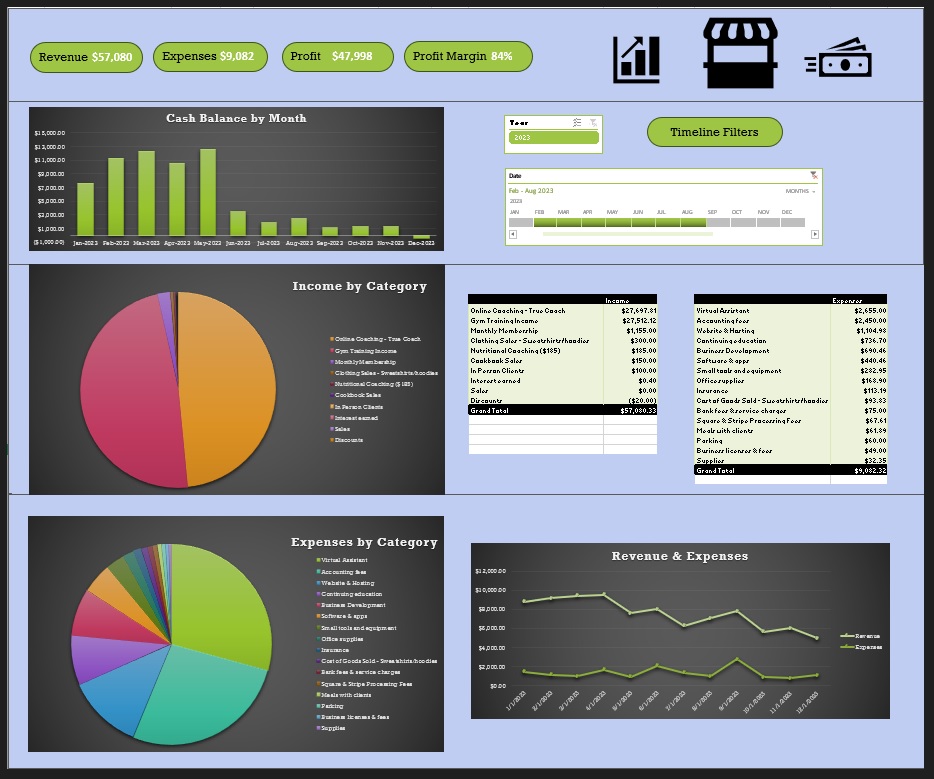
Interactive Financial Metric Reports
Financial statements cleaned and transformed in Excel and Power Query. Data organized into pivot tables to assess essential YTD information, then sent to an interactive dashboard. This project helped improve the amount of data that could be queried at once as well as easily updated month to month to assist with identifying business insights and trends such as budget vs actual metrics.